


Known as the “humble heroes” of globalization, containers are handled in hundreds of millions at container ports worldwide annually. Efficient and well-connected container ports enabled by frequent and regular shipping services are key to minimizing trade costs, including transport costs, linking supply chains and supporting international trade. Thus, port performance is a critical factor that can shape countries’ trade competitiveness. Every hour of port time saved by ships translates into savings in port infrastructure expenditure for ports, ship capital costs for carriers, and inventory holding outlays for shippers.
Recognizing the importance of measuring container port performance, UNCTAD developed the Liner Shipping Connectivity Index (LSCI) in 2004 to determine countries’ positions within global liner shipping networks; the latest country-level LSCI statistics were published in July 2019. Subsequently, on 7 August, UNCTAD launched two new datasets:
1. The port LSCI. This indicator draws upon the same methodology applied to the country-level LSCI. It is developed in collaboration with MDSTransmodal and covers more than 900 ports over the 2006-2019 period.
2. A new comprehensive table that features port calls by country, the typical turnaround time as well as the average size and age of ships. The statistics are derived from automatic identification system (AIS) data in collaboration with MarineTraffic. The first year of coverage is 2018, with updates scheduled every six months.
The two new datasets complement existing UNCTAD maritime statistics and indicators that measure and track progress towards the achievement of the Sustainable Development Goals and their targets. Insights generated by the new data will help businesses and governments identify global trends in liner shipping connectivity and port efficiency as well as monitor the position of their ports within the global container ports landscape.
Ports in smaller countries tend to provide transhipment services to larger neighbouring countries. Often, smaller economies benefit from cabotage restrictions in larger neighbouring countries, as these restrictions limit the options of connecting (feedering) services along the coasts, e.g. of Brazil, India, Japan or the United States. Colombo (Sri Lanka) has a higher LSCI than any Indian port, Montevideo (Uruguay) has significantly improved its connectivity, while the LSCI of Santos (Brazil) has been stagnant. In the Caribbean, Balboa (Panama), Caucedo (Dominican Republic) and Kingston (Jamaica) have long been leading hub ports.
The expanded Panama Canal has led to shifts in service patterns. The LSCI of New York/ New Jersey and Savannah on the east coast of North America grew by more than 20% since 2016, while the leading ports on the west coast of North America have seen their LSCIs stagnate. The all-water route from Shanghai to the east coast has gained competitiveness vis-à-vis the competing land bridge and the Suez Canal route. Ports in Panama and Cartagena in Colombia saw their respective LSCI scores increase significantly. There are still no major hub ports on the west coast of South America.
New investments attract additional services. Investment growth (public and private, as well FDIs) in ports generate new services and activities. It’s worth noting that Piraeus (Greece), operated by COSCO (China), has become the best-connected port in the Mediterranean in 2019. Other ports with Chinese investments that have seen their LSCIs go up include Colon (Panama), Khalifa (UAE) and Lomé (Togo). West African ports have attracted direct services from China, leading to larger vessels being deployed on these routes.
Africa: Both geography and port reforms matter. The best- connected ports in Africa are those located at the north-eastern, north-western and southern edges of the continent, i.e. ports in Morocco, Egypt and South Africa. In comparison, western African ports display relatively lower connectivity levels given their location outside the trajectory of major north-south and east-west shipping routes. Mombasa (Kenya) and Dar es Salaam (Tanzania) connect Burundi, Rwanda and Uganda to overseas markets through dedicated corridors; however, they remain highly congested.
Asia: China’s ports feature at the top of the list. Shanghai is the best-connected port in the world today; it has overtaken Hong Kong, China SAR, which ranked first in 2006. Ningbo doubled its LSCI since 2006. Outside China, the highest LSCI scores were recorded in Singapore and Busan (Republic of Korea). Connectivity in Kobe and Nagoya (Japan) declined over the last decade, reflecting slower economic growth in Japan and the fact that its ports are less competitive as transhipment centres.
Pacific: The plight of Small Island Developing States (SIDS): Pacific Island countries exhibit some of the lowest shipping connectivity levels worldwide. Port Vila (Vanuatu) receives about one container ship every three days, and there are only four companies providing any regular shipping services to the country. In Kiribati, only one operator is offering regular liner shipping services, with one ship arriving about every 10 days. Many SIDS are confronted with a vicious cycle where low trade volumes discourage investments that would improve maritime transport connectivity. At the same time, low connectivity also translates into more costly and less competitive trade.
What can be done to improve a port’s connectivity? The following seven policy measures are key to enhancing port connectivity:
1. Go digital. Digital and physical connectivity go hand in hand. Just as trade benefits from the latest technologies such as artificial intelligence, the Internet of Things and blockchain, port and shipping operations would also benefit from taping the opportunities arising from digitalization.
2. Link domestic, regional and global networks. Restrictions affecting regional or domestic cabotage markets limit the ability of shipping lines to consolidate cargo. Allowing international lines to also carry domestic trade and feedering cargo can enhance both the competitiveness of the port and shippers’ access to overseas markets.
3. Ensure competition. Considered prior analysis is required before assigning port concessions to terminal operators who are associated with shipping lines through vertical integration. On the one hand, such operators can attract port calls from associated lines and alliances. On the other, however, such vertical integration could discourage other lines from calling at the port and could limit choices available to shippers.
4. Port modernization. Port clients, i.e. the shipping lines and the traders, require fast, reliable and cost-efficient services to ships and cargo. Ports need to continuously invest in their technological, institutional and human capacities. Public and private cooperation is key in this regard.
5. Widen the hinterland. Ports should aim at attracting cargo from neighbouring countries and domestic production centres. There is a common interest between many seaports and traders in neighbouring countries, especially landlocked countries. Investments in corridors, regional trucking markets, and cross-border trade and transit facilitation can help expand ports’ hinterlands.
6. Promote sustainability. Port stakeholders are varied and may include shipping lines and traders, as well as social partners and the port-city community. Stakeholders are increasingly demanding that ports deliver on their social, economic and environmental sustainability obligations.
7. Monitor ports’ connectivity. Policy makers, port authorities and investors need to continuously monitor trends in the global shipping network, the geography of trade, fleet deployment, and port performance. UNCTAD’s Review of Maritime Transport and the complementary online statistical information and country profiles support this monitoring objective.
Containerships have the lowest turnaround times. In 2018, a given ship spent a median of 23.5 hours in ports, i.e. 0.97 days. Dry bulk carriers spent typically 2.05 days during a port call, while container ships spent on average the least amount of time (0.7 days). Performances ranged between 0.23 days in the Faroe Islands and six and a half days in the Maldives. Figure 1 illustrates the global distribution of port calls for container ships and the median time spent in ports.
Figure 1: Container ship port calls and time in port (days), 2018

NOTE: Ships of 1000 GT and above. Source: UNCTAD calculations, based on data provided by MarineTraffic (https://www.marinetraffic.com/). Illustration produced by Julian Hoffmann
A shorter time in the port is generally indicative of high port efficiency and trade competitiveness. The bottom ten countries on the list are all developing countries or least developed countries, while the economies with the fastest turnaround times are mostly advanced economies with large volumes (Norway, Japan) or small economies, which handle low cargo volumes at each port call. A longer time spent in the port does not necessarily mean that the port is less efficient, as ship owners may choose to have their ships stay longer in a port to purchase goods or services.
Countries with more port calls usually have lower turnaround times. The causality goes both ways: If in a given port, turnaround is faster while maintaining the same number of berths, this means the port can accommodate a larger number of port calls. At the same time, a faster turnaround time is more appealing to shippers and carriers. Consequently, the number of port calls will be higher compared to a competing port that has a lower turnaround time. Figure 2 illustrates the correlation between the number of port calls, the size of the largest container ships deployed, and the median time that container ships spend in ports.
Figure 2: Time in port (days) and number of port calls, 2018, container ships
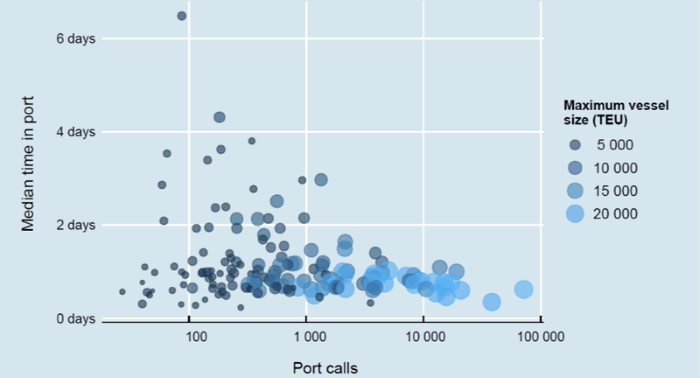
NOTE: Ships of 1000 GT and above. Source: UNCTAD calculations, based on data provided by MarineTraffic (https://www.marinetraffic.com/).
Illustration produced by Julian Hoffmann.
If ships are larger, ceteris paribus, turnaround time should be higher, as there will be more cargo to be loaded and unloaded. At the same time, ports that can handle larger ships will usually also be more modern and efficient. There is a negative correlation between the size of the largest ship calling at a port and the port time of ships, and a slightly positive correlation between the average size of ships calling at the port and the port time of ships.
Put differently, being able to accommodate very large container ships could indicate that ports are fast and efficient. However, servicing larger ships that carry large volumes will, on average, also take slightly more time to load and unload. In addition, being able to accommodate ever bigger ships can improve ports attractiveness as hubs.
However, it may also lead to fewer services and service provider choices to shippers, and create challenges that undermine the landside of operations, especially when larger vessels arrive off schedule. This, in turn, could drive up total door-to-door logistics costs and compress trade volumes.
What can be done to improve ships turnaround time? Three policy measures could help improve port performance:
1. Port call optimization: Ships should only arrive at the right time, i.e., when they need to arrive, as arriving too early implies additional costs in ports, and sailing at unnecessarily high speeds would generate more air emissions including carbon dioxide (CO2). To arrive on time rather than in time is the aim of port call optimization initiatives. Making use of digitalization means that data will need to be exchanged between shipping lines, ports, shippers and intermodal transport providers.
2. Facilitation: Once a ship arrives at a pier, operations should start immediately, without having to wait for authorities to clear paperwork. The FAL Convention of the International Maritime Convention can help as far as the vessel is concerned, while the implementation of the Trade Facilitation Agreement of the World Trade Organization can help speed up the process of cargo clearance, including measures such as customs automation, pre-arrival processing and border agency cooperation.
3. Port operations: Fast and reliable loading and unloading operations require investment in infrastructure and superstructures, as well as technological and human capacities. Privatizing port operations and assets can help, but needs to be planned carefully with public and private sectors’ roles clearly delineated. Total logistics costs need to be taken into account when considering such investments.
Source: UNCTAD
Tagged with: Tops
 PG-Software