


Geopolitical risks continue to be a major force driving commodity markets. With about 40% of global oil exports passing through the Persian Gulf and Red Sea region, oil transportation costs and insurance premiums could rise amid escalating tensions in the Middle East. In Russia, refineries struggle to repair facilities damaged by Ukraine drone strikes, impacting exports. China’s compliance carbon and US aluminum prices are also in focus.
1. Israel-Iran face-off ups Persian Gulf tankers freight rates

What’s happening? Israel’s retaliatory attack on Iran April 19 has escalated tensions in the Middle East, increasing the risk of moving oil and gas through the Strait of Hormuz, a narrow seaway through which more than 20 million barrels of oil and refined products, equivalent to 10 VLCCs, as well as over 10 Bcf of LNG move daily. Freight is elevated due to this serious risk, with the Persian Gulf-North Asia Long Range rate at its highest level in almost three weeks.
What’s next? The probability of a large-scale Israel-Iran war that can engulf the entire Persian Gulf is relatively low but the risk of skirmishes turning into a full-blown conflict is intact. There is an upside to tanker freight. Insurance companies could seek higher war risk premium to load cargoes from the Persian Gulf. The overall cost of delivering energy commodities sourced from the Persian Gulf could also rise.
2. Russian oil product exports slump to multiyear low after refinery attacks

What’s happening? Russian oil product exports slumped to a post-pandemic low in the first half of April, according to tanker tracking data, as the impact of drone strikes on its refineries and flooding weigh on the country’s key export commodity. Seaborne Russian export loadings of diesel, fuel oil, naphtha and other refined products averaged 1.81 million b/d during the week ending April 14, according to S&P Global Commodities at Sea, a 560,000 b/d slump from March and more than 830,000 b/d below January levels when Ukraine began a barrage of long-range drone strikes on Russian refining capacity. The last time Russian product exports fell below 2 million b/d was during the peak of COVID-19 lockdowns in mid-2020.
What’s next? As Russia struggles to repair its damaged refineries, oil markets have remained focused on the impact on the country’s crude exports. Market watchers expected some additional crude flows to be backed out by Russia depending on whether the damaged refineries are linked to domestic fuel supply or export infrastructure. The latest tanker data suggests that, following a sharp drop in the first week of April, Russia’s weekly seaborne crude loadings reverted to their longer-term average by April 15.
3. Netherlands more dependent on gas imports following Groningen closure

What’s happening? The law to permanently close the giant onshore Groningen gas field in the Netherlands took effect on April 19, ending any uncertainty over the field’s future. Production from Groningen — which topped 80 Bcm/year in the mid-1970s — was first halted in October 2023 following a government order, with the state saying output could only resume temporarily during the winter of 2023-24 in the event of “extreme cold.” Production had been sharply reduced since 2013 due to the risk of earthquakes associated with drilling at the field.
What’s next? Dutch grid operator GTS said in March that expanded LNG import capacity and seasonal storage would be key to ensuring gas supply security in the Netherlands following the closure of Groningen. The Netherlands currently depends on imports for 75% of its gas consumption, and with further declining domestic production the dependence is set to become even greater, it said.
4. China’s compliance carbon price hits a new high of $13.55/mtCO2e on April 22
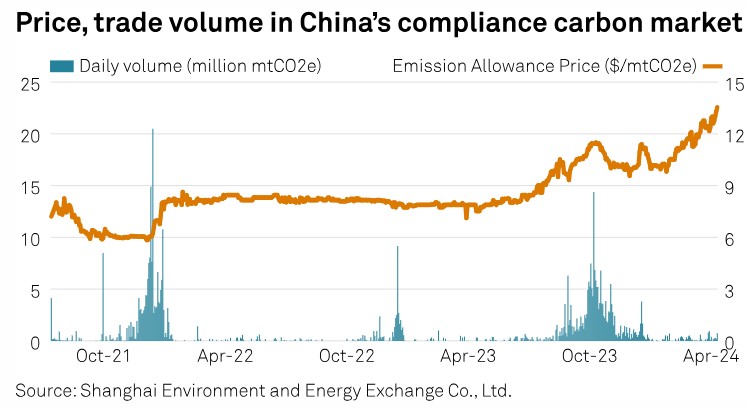
What’s happening? China’s compliance emission allowance price hit a new high on April 22, reaching Yuan 96.26/mtCO2e ($13.55/mtCO2e), up 4.3% week on week. Notably, the CEA prices have been hitting multiple highs since February, as the government issued a series of policies to impose more severe penalties, support the compliance market’s expansions to cover the cement and aluminum industries, and tighten future CEA supply. Last week, the Chinese government kicked off consultations on compliance emissions trading rules to be implemented in 2024-25, aimed at addressing the oversupply in the market.
What’s next? Recommendations in the consultation document, if fully implemented, could significantly cut emissions allowance supply and drive prices higher. Several companies have reportedly started hoarding CEAs amid expectations of higher and more volatile prices. Draft rules, however, are typically open to changes, depending on industry feedback. Some power companies, especially those that are facing financial difficulties and have relatively inefficient coal-fired power generation units, are expected to propose changes for the government to consider, including the relaxation of some of the rules and increasing market supply.
5. US aluminum price direction uncertain after latest bans on Russian aluminum

What’s happening? The US and UK issued new prohibitions in April that would prevent trade exchanges in the countries from accepting new aluminum, copper and nickel produced by Russia after April 12. The US also banned the import of these metals. For the US, this is the latest in a series of trade moves since 2018 targeting Russia’s aluminum. The Platts Aluminum P1020 Transaction Premium delivered US Midwest was assessed at 18.75 cents/lb April 19, falling from 19.44 cents/lb April 15, the first day of trading after the sanctions were announced.
What’s next? Market participants in the US are monitoring how the latest moves could impact US aluminum prices. Since 2018, the premium has been shown to rise in anticipation of trade actions against Russian aluminum, and then retreat shortly after the trade actions are implemented. This trend appears to be occurring again. However, some analysts believe the new prohibitions could ultimately raise regional premiums in the long term.
6. European PPA price indicators recover from February lows
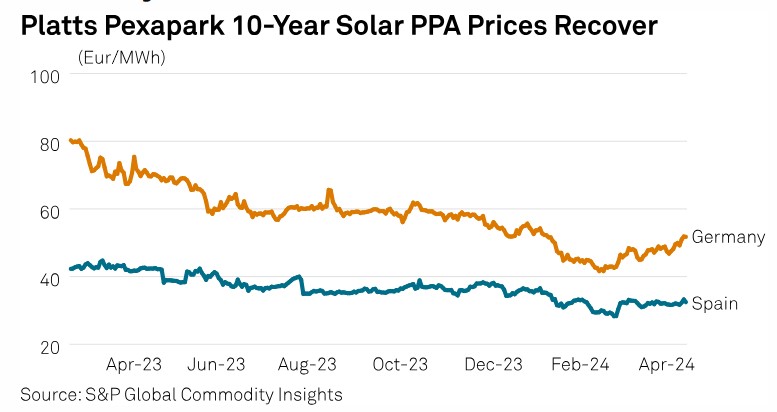
What’s happening? Price indicators for long-term power purchase agreements for solar projects in Europe have rebounded from the lows seen in February. The Platts-Pexapark PPA index for standard 10-year German solar PPAs starting in 2025 was pegged at Eur53.17/MWh April 16, up 28% from its Feb. 16 low. Spain remains significantly lower after Spanish solar capture prices averaged Eur11.45/MWh in March, the lowest monthly volume-weighted average on record with the technology capturing only around 56% of wholesale market values, according to the Platts Renewable Energy Price Explorer. Platts is part of S&P Global Commodity Insights, which is a minority stakeholder in Pexapark.
What’s next? European PPA activity in Q1 hit a new record for the quarter with some 7.5 GW of renewable capacity securing a PPA, up 21% year on year, according to S&P Global’s PPA database. Analysts at S&P Global forecast some 32 GW of utility-scale solar projects to get built in Spain over the next five years (2024-2028), noting a potential oversupply and developers rushing to fix deals as soon as possible before prices keep dropping.
Source: Platts
 PG-Software