


Descartes Systems Group (Nasdaq: DSGX) (TSX:DSG), the global leader in uniting logistics-intensive businesses in commerce, released its January report on U.S. container imports for logistics and supply chain professionals. The report shows that December U.S. container import volumes declined slightly from November to align with December 2019 levels. Port delays continue to decrease, with top East and Gulf Coast ports seeing the greatest reduction. Key economic indicators during this period continue to paint a conflicting picture about their impact on future import volumes and, combined with COVID, the Russia/Ukraine conflict and the West Coast labor situation, continue to point to further disruptions and challenging global supply chain performance in 2023.
December 2022 U.S. container import volumes declined 1.3% from November to 1,929,032 TEUs (see Figure 1). Versus December 2021, TEU volume was down 19.3%, and only 1.3% higher than pre-pandemic December 2019. Note that December has the holiday season in the second half of the month which can adversely impact container import volumes.
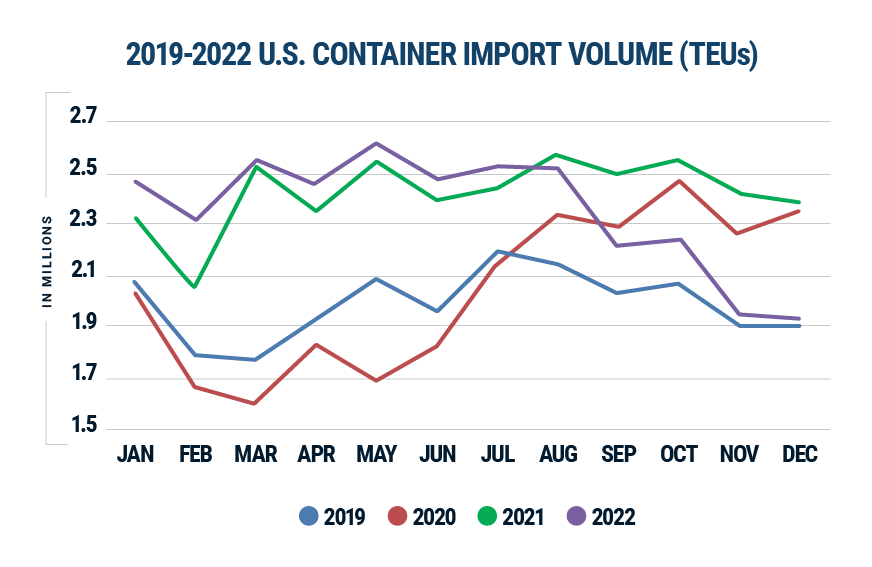
U.S. Container Import Volume Year-over-Year Comparison
“Comparing fall imports in 2022 to the previous six years, the slight decline in December 2022 volume versus November 2022 was consistent at -1.3% (see Figure 2). Imports from China also declined, but even more slowly at -0.5%,” said Chris Jones, EVP Industry & Services at Descartes. “The December U.S. container import data points to less pressure on supply chains and logistics operations, but there are still a number of issues that may cause further disruptions in 2023.”
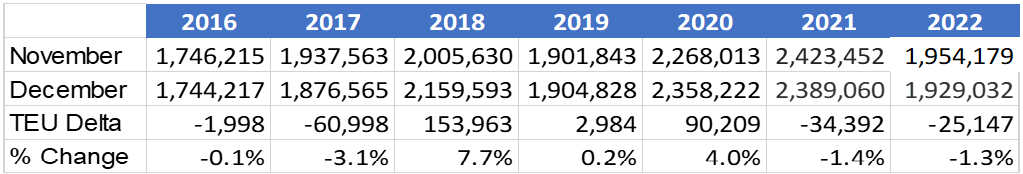
November to December U.S. Container Import Volume Comparison
While the overall volume was down slightly, half of the top 10 U.S. ports saw volume increases with the Port of Los Angles reporting the greatest overall increase (see Figure 3). The Ports of Houston and New York/New Jersey experienced the greatest decline.
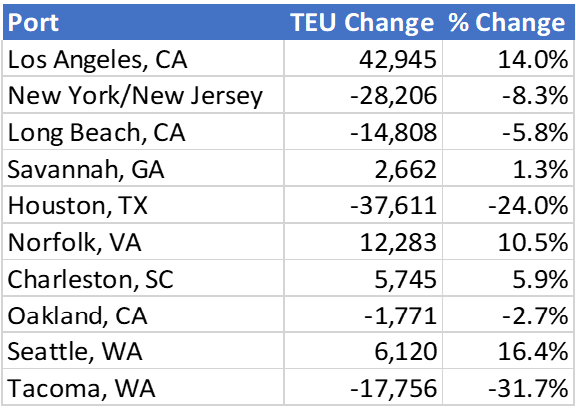
Source: Descartes Datamyne™
The downward trend continued in December for U.S. container imports from China to 686,514 TEUs with a smaller reduction of 0.5% versus November and down 31.9% from the 2022 high in August. China represented 35.4% of the total U.S. container imports, a decline of 6.1% from the high of 41.5% in February 2022. South Korea and India experienced the greatest decline while Japan had strong growth of the top 10 countries importing into the U.S. (see Figure 4).
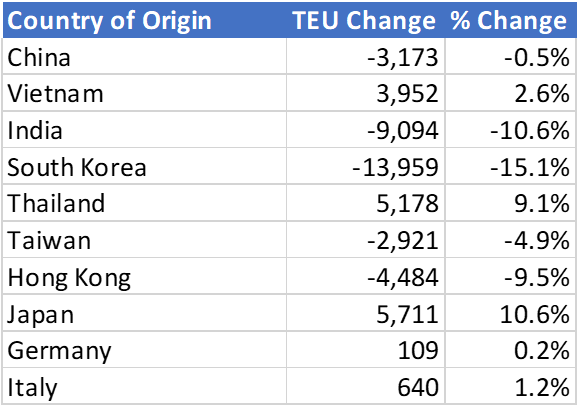
Source: Descartes Datamyne
West Coast ports gain market share.
In December, top West Coast ports reversed their market share decline versus top East and Gulf Coast ports. Comparing the top five West Coast ports to the top five East and Gulf Coast ports in December 2022 versus November 2022 shows that, of the total import container volume, the West Coast ports grew to 38.1% in December, up 1.2% versus November and the East and Gulf Coast ports declined in December to 45.5%, down 1.7% versus November. The top 10 ports again lost share in December 2022 to smaller ports, as the top 10 represented 83.6% of all volume compared with 84.1% in November 2022 and 85.9% year-on-year.
Comparing five-month periods (see Figure 5), the top West Coast ports (orange) continue to experience container throughput shifts to other ports, including the East and Gulf Coasts (blue). However, with the exception of the Port of Houston, the top East and Gulf Ports are now operating below peak volumes that started the port congestion in 2021. Returning to the top container import processing port was the Port of Los Angeles at 349,493 TEUs. The Port of New York/New Jersey fell to second at 312,763 TEUs in December 2022.
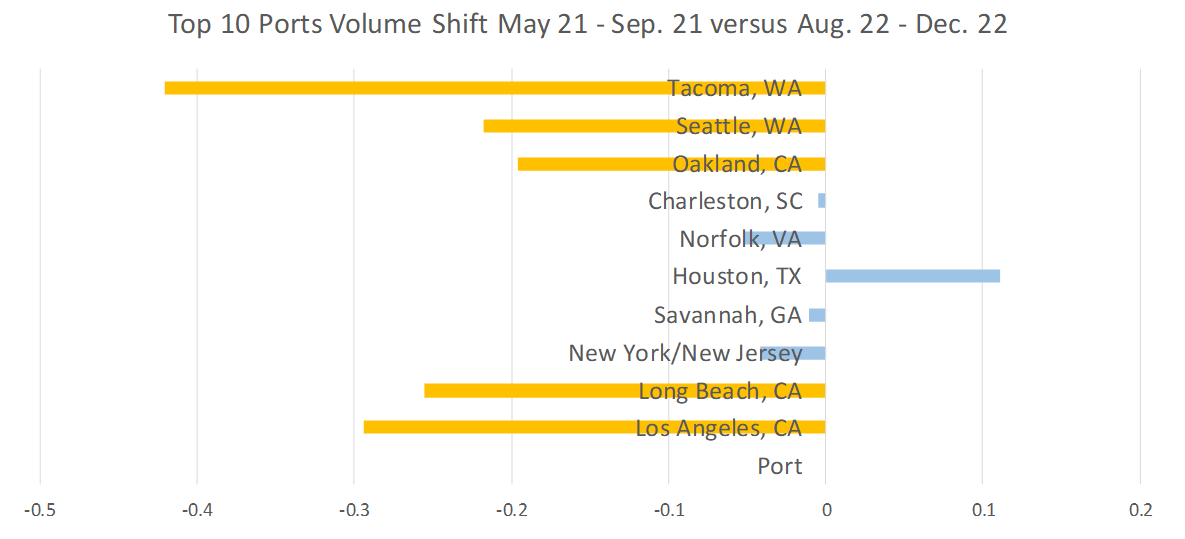
Container Import Volume Shifts at the Top 10 Ports
December port delays continue to decline, especially for the East Coast ports.
Overall port delays in December 2022 were lower than November 2022 (See Figure 6). The major East Coast ports saw the greatest decrease and had no double digits wait times. The major West Coast ports are all now well below 10 days and somewhat stabilized. Much of the progress can be attributed to the continued reduction in volume that the majority of ports are experiencing. While wait times have made significant progress, schedule reliability still remains low when compared to pre-pandemic numbers. According to FreightWaves/Sea Intelligence, schedule reliability is almost 20% lower than 2019.
Monthly Average Delays (in days) at Top 10 Ports Source: Descartes Datamyne™ Note: Descartes’ definition of port delay is the difference as measured in days between the Estimated Arrival Date, which is initially declared on the bill of lading, and the date when Descartes receives the CBP-processed bill of lading
Labor, COVID and macroeconomic issues persist.
The labor situation remains unchanged and presents continued risk to West Coast port operations. The International Longshore and Warehouse Union (ILWU) contract expired on July 1; however, business has proceeded as usual with the union working with management. Until now there has been no impact on container processing as has been the case in the past. California law AB5 still remains a significant issue with no resolution in sight and there is a risk that more AB5-related stoppages could occur in other California ports in the future causing greater disruption. The continuing labor uncertainty could be a significant reason why import volumes are not shifting back to major California ports despite their improving situation.
The Chinese government has just revised its COVID policies in an effort to minimize the disruptions to society and business. COVID infection is widespread and given that the Chinese population has little to no immunity, the impact of COVID on manufacturing supply chains could continue for quite some time.
Key economic indicators provide a mixed view of the U.S. economy and, ultimately, demand for imports. Employment increased by 223,000 jobs in December and unemployment declined to record levels at 3.5%. Strong employment numbers often put pressure on supply chain and logistics operations as they are labor intensive and compete more broadly to find resources. Inflation remains high and the U.S. Federal Reserve will again evaluate the need to raise interest rates which could dampen inflation. According to the U.S. Energy Information Association, gasoline costs, a significant contributor to high inflation rates, declined slightly to $3.22/gallon and is back to 2021 prices for the same period. Diesel costs also saw a reduction to $4.58/gallon. Both are likely to remain elevated for the foreseeable future given the disruption of global energy markets as a result of the war in Ukraine and subsequent sanctions on Russia.
Source: Descartes
 PG-Software